Croatia:
Population StatisticsPopulation: 4,464,844
Density: 75.7 people/sq. km Net Migration Rate: 1.39 migrant(s)/1,000 population Birth Rate: 9.45 births/1,000 population Death Rate: 12.18 deaths/1,000 population Rate of Natural Increase: -2.64 Population Growth Rate: -0.13% Infant Mortality Rate: 5.77 deaths/1,000 live births Total Fertility Rate: 1.46 children born/woman Population Age <15 %: 22.5% Population Ages 65+ %: 28.6% Dependency Rate: 51.1% Life Expectancy at Birth: 76.61 years Life Expectancy at Birth: Females: 80.4 years Males: 73.02 years Primary School Completion Rate: Females: 15 years Males: 14 years Secondary School Enrollment: Net Females: 98 Net Males: 98 GNI PPP per capita in US$: $20,560 Economically Active Females 15+: 46% Economically Active Males 15+: 60% Mobile Phone Subscribers: 104 per 100 Motor Vehicles: 380/ 1000 people Undernourished Population: N/A Underweight Children Under Age 5: N/A HIV/AIDS Among People Ages 15-49: <0.1% Demographic Transition Model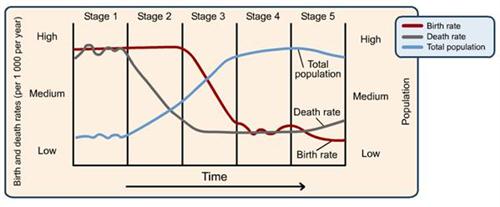
Croatia is in the fourth or fifth stage of the demographic transition. It's death rate at 12 deaths per 1000 people is greater than its birth rate at 9 births per 1000 people resulting in a decline in population. The life expectancy is high and fertility rate is low which is characteristic of countries in stage 4 to 5.
Gapminder Active Chart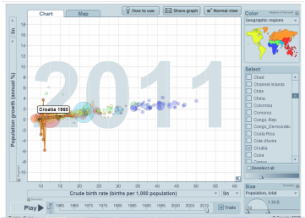
Click on the image to see an overtime animation of population growth and crude birth rates.
For this Gapminder Active Chart, I chose to explore the Population Growth (annual %) and Crude Birth Rates (births per 1000 population) to see the effects these have on one another. For Croatia, as the years pass from 1960 to 2011, both the population growth and CBR decrease at a steady state, only fluctuating in the 90s and early 2000s. This rate then levels off at -2.5 population growth and a CBR of 9.9 in 2011.
|
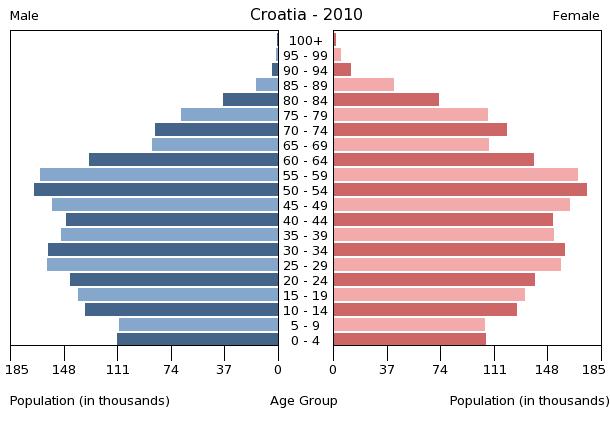
Population Pyramids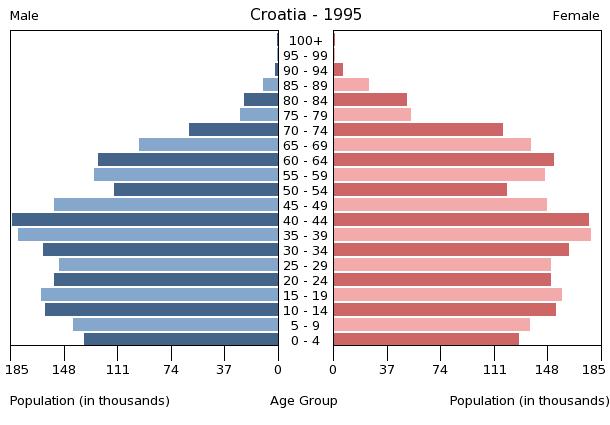
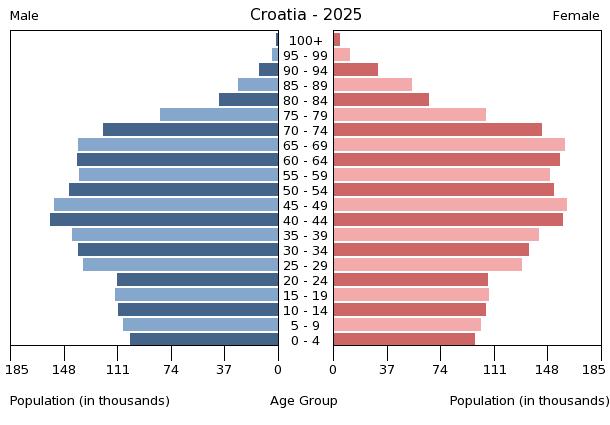
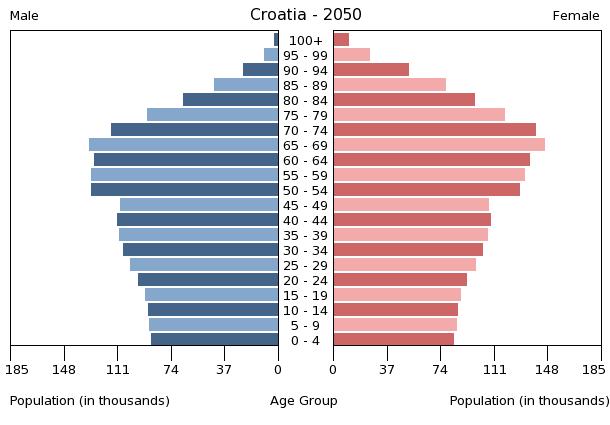
|
