Burkina Faso:
Population StatisticsPopulation: 18,931,686
Density: 61.90 people per sq. km Net Migration Rate: 0 migrant(s)/1,000 population Birth Rate: 42.03 births/1,000 population Death Rate: 11.72 deaths/1,000 population Rate of Natural Increase: 30.96 Population Growth Rate: 3.03% Infant Mortality Rate: 75.32 deaths/1,000 live births Total Fertility Rate: 5.86 children born/woman Population Age <15 %: 87.6% Population Ages 65+ %: 4.6% Dependency Rate: 92.2% Life Expectancy at Birth: 55.12 years Females: 57.21 years Males: 53.1 years Primary School Completion Rate: Females: 40% Males: 46% Secondary School Enrollment: Net Females: 20 Net Males: 23 GNI PPP per capita in US$: 1,650 Economically Active Females 15+: 78% Economically Active Males 15+: 91% Mobile Phone Subscribers: 72 per 100 people Motor Vehicles: 12 per 1000 people Undernourished Population: 21% Underweight Children Under Age 5: 26.2% HIV/AIDS Among People Ages 15-49: 0.94% Demographic Transition Model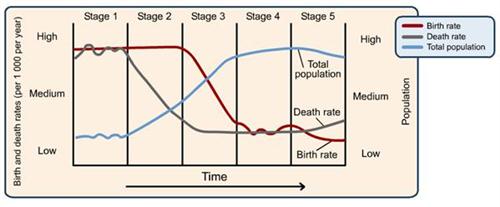
Burkina Faso is in stage 2 of the Demographic Transition. It has a fertility rate between 5 and 6.5, a high birth rate of 42 and declining death rate of 11, and an increasing rate of natural increase. Their children enter into the workforce between ages 10 and 14 and little improvements in medical care and water sanitation are made which indicates stage 2.
Gapminder Active Chart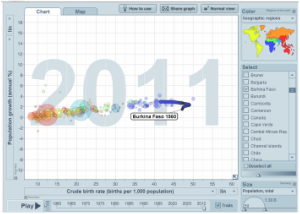
Click on the image above to see an overtime animation of population growth and crude birth rates.
For this Gapminder Active Chart, I chose to explore the Population Growth (annual %) and Crude Birth Rates (births per 1000 population) to see the effects these have on one another. For Burkina Faso, the CBR increases from 1960 to 1980, then decreases from 1980 to 2011. The population growth still continues to increase from 1.5% to 3% even with the declining birth rate. Notice how high Burkina Faso's CBR and population growth compare to the rest of the world.
|
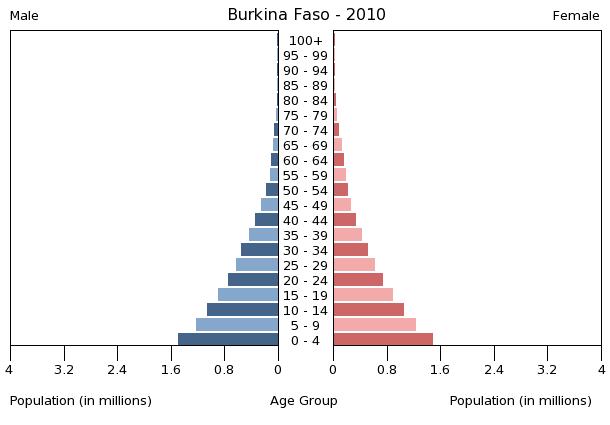
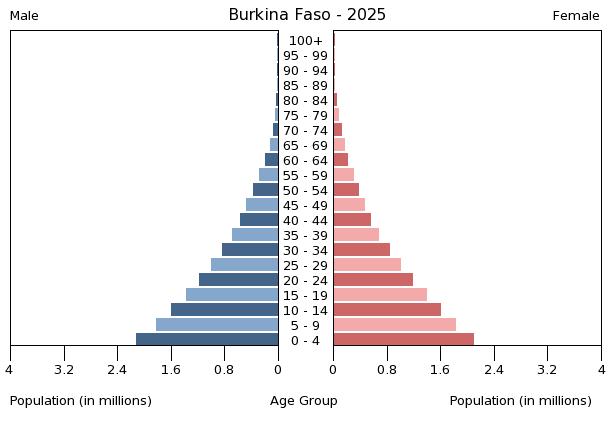
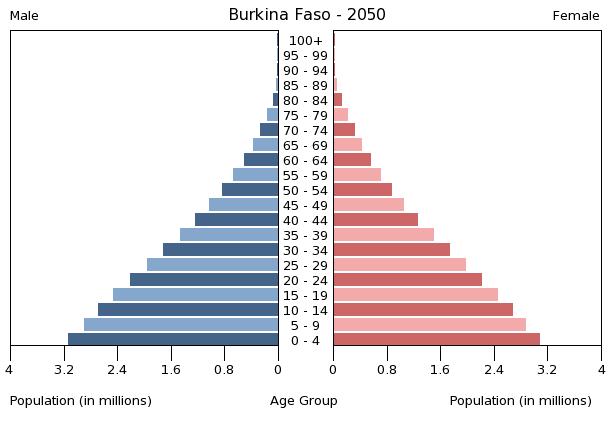
Population Pyramids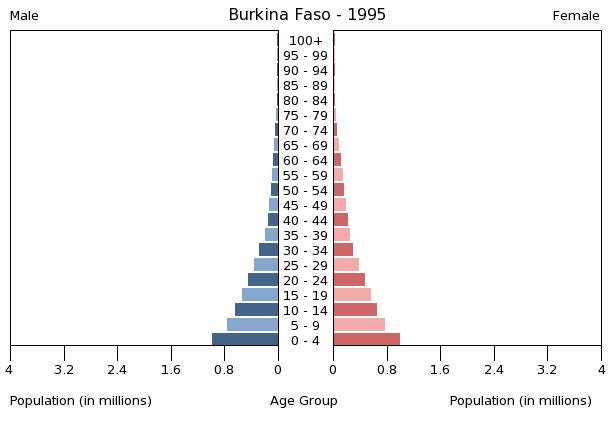
|
