Israel:
Population StatisticsPopulation: 8,049,314
Density: 308 people/sq.km Net Migration Rate: 2.24 migrants/1,000 population Death Rate: 5.15 deaths/1,000 population Rate of Natural Increase: 14.06 Population Growth Rate: 1.56% Infant Mortality Rate: 3.55 deaths/1,000 live births Total Fertility Rate: 2.68 children born/woman Population Age <15 %: 45.7% Population Ages 65+ %: 18.4% Dependency Rate: 64.1% Life Expectancy at Birth: 82.27 years Females: 84.21 years Males: 80.43 years Primary School Completion Rate Females: 100% Males: 99% Secondary School Enrollment Net Females: 101 Net Males: 102 GNI PPP per capita in US$: $32,550 Economically Active Females 15+: 52% Economically Active Males 15+: 63% Mobile Phone Subscribers: 121 Motor Vehicles: 358 vehicles/1000 people Undernourished Population: N/A Underweight Children Under Age 5: N/A HIV/AIDS Among People Ages 15-49: 0.2% Demographic Transition Model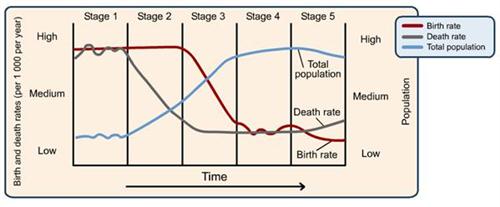
Israel is in stage 3-4 of the demographic transition primarily because its CBR is 21 per 1000 people. The population does continue to grow though because the CBR of 21 is greater than the CDR of 5. Because of medical advancements in stage 2, the infant mortality rate is at a low of 3.55 which means that there is a higher CBR. With CBR and CDR both dropping, the population will continue to increase. The socio-economic advancements in Croatia has lead to the advancement in the demographic transition stages.
Gapminder Active Chart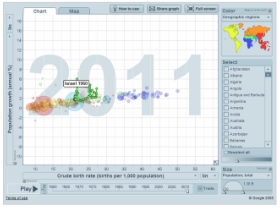
Click on the image above to see an overtime animation of population growth and crude birth rates.
For this Gapminder Active Chart, I chose to explore the Population Growth (annual %) and Crude Birth Rates (births per 1000 population) to see the effects these have on one another. For Israel, as the years pass from 1960 to 2011, the CBR steadily decreases and the population growth begins at 3.7% and levels off at 1.8% which shows correlation between the two rates.
|
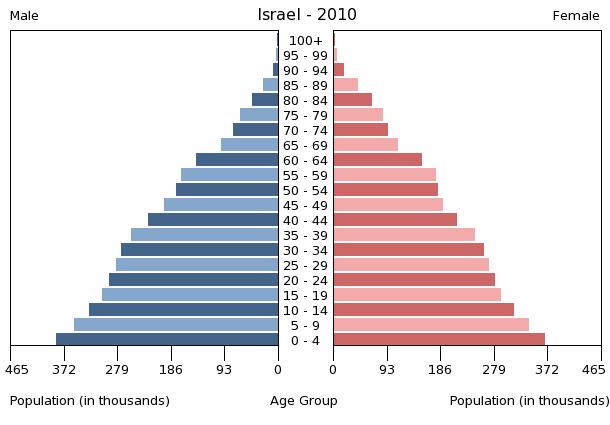
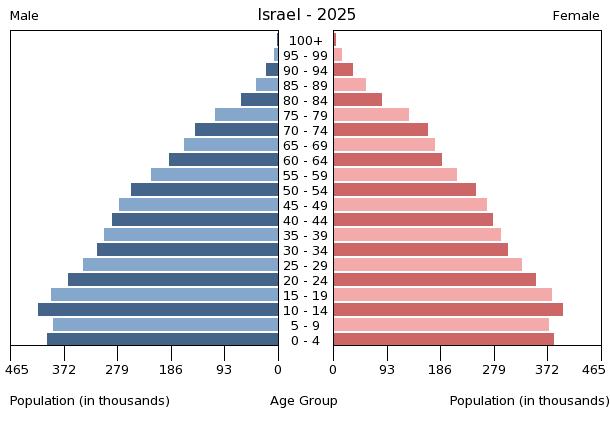
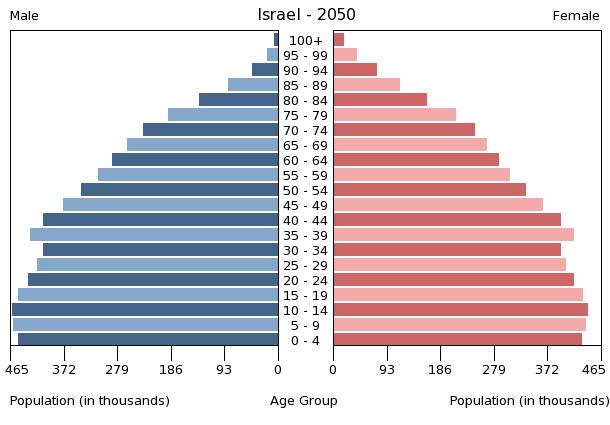
Population Pyramids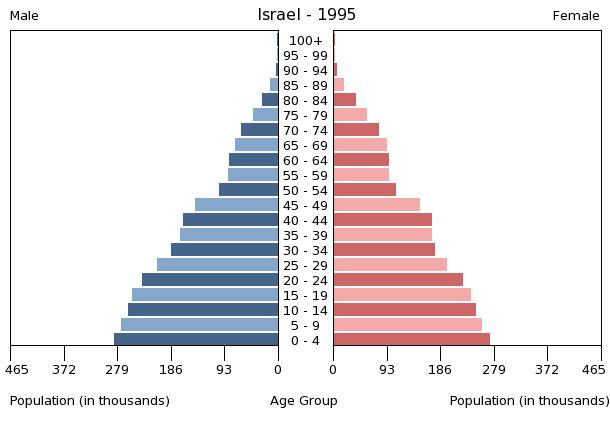
|
