El Salvador:
Population StatisticsPopulation: 6,141,350
Density (people per sq. km): 306.01 people/ sq. km Net Migration Rate: -8.28 migrants/1,000 population Birth Rate: 16.46 births/1,000 population Death Rate: 5.69 deaths/1,000 population Rate of Natural Increase: 10.81 Population Growth Rate: 0.25% Infant Mortality Rate: 17.86 deaths/1,000 live births Total Fertility Rate: 1.91 children born/woman Population Age <15 %: 41.7% Population Ages 65+ %: 12.6% Dependency Rate: 54.3% Life Expectancy at Birth: 74.42 years Females: 77.86 years Males: 71.14 years Primary School Completion Rate: Females: 95% Males: 92% Secondary School Enrollment: Net Females: 63 Net Males: 61 GNI PPP per capita in US$: 3,950 Economically Active Females 15+: 46% Economically Active Males 15+: 77% Mobile Phone Subscribers: 144 per100 people Motor Vehicles: 94 per 1000 people Undernourished Population: 14% Underweight Children Under Age 5: 6.6% HIV/AIDS Among People Ages 15-49: 0.53% Demographic Transition Model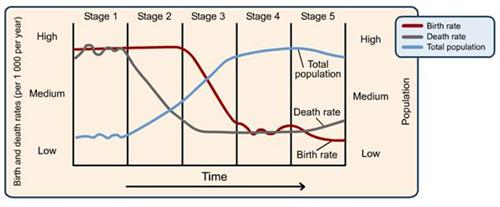
El Salvador is in stage 2 or 3 of the Demographic Transition. Its CBR is at 16 while its CDR is at 5 but the fertility rate has decreased significantly putting this country in stage two to three.
Gapminder Active Chart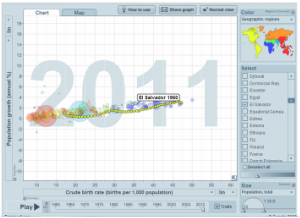
Click on the image above to see an overtime animation of population growth and crude birth rates.
For this Gapminder Active Chart, I chose to explore the Population Growth (annual %) and Crude Birth Rates (births per 1000 population) to see the effects these have on one another. In El Salvador, the CBR and population growth steadily decline from 47 and 2.9% in 1960 to 18 and 2.7% in 2011. As the CBR continues to decrease, the population growth with continue to decrease as well.
|
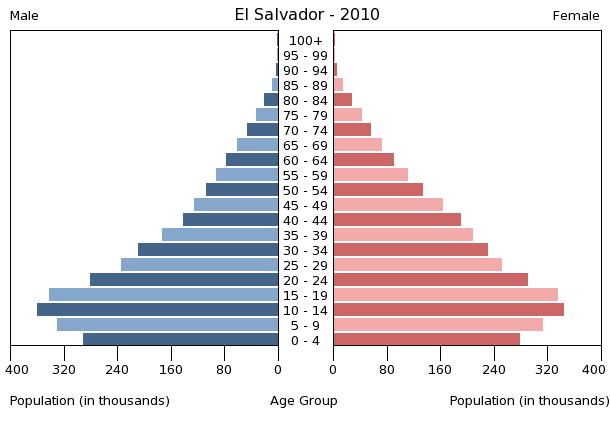
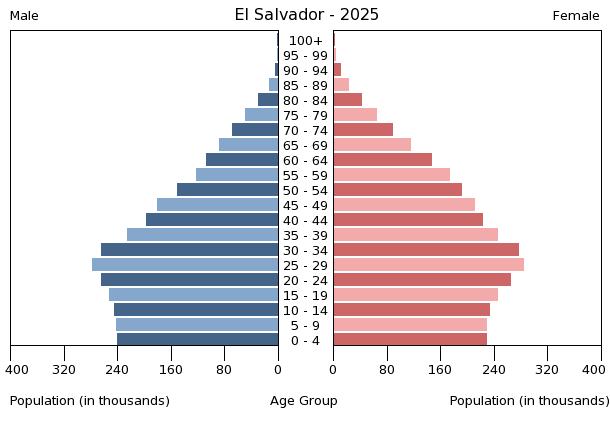
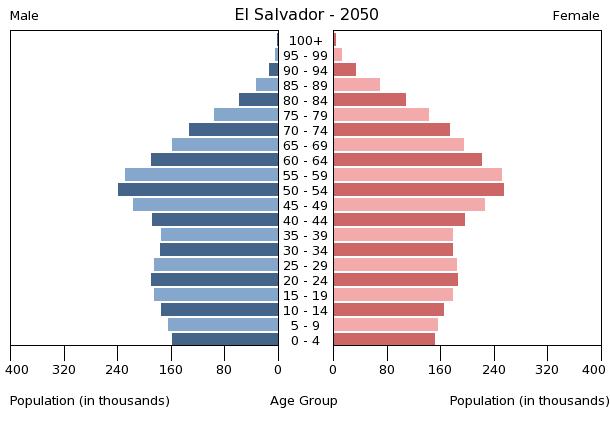
Population Pyramids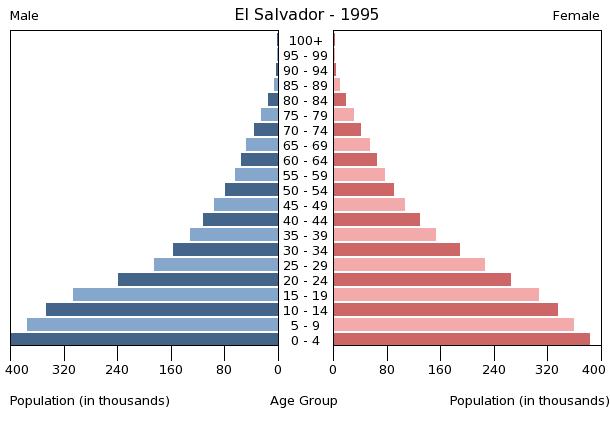
|
